Figure 1: Annual Deforestation for Eight Southeast Asian Countries.
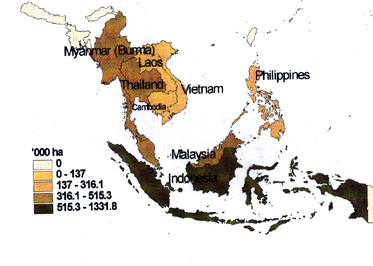 |
| Source: Summary of the Final Report of the Forest Reserves Assessment 1990 for the Tropical World, Food and Agriculture Organization, March 1993. |
Figure 2: Palm Oil Production increase in Southeast Asia.
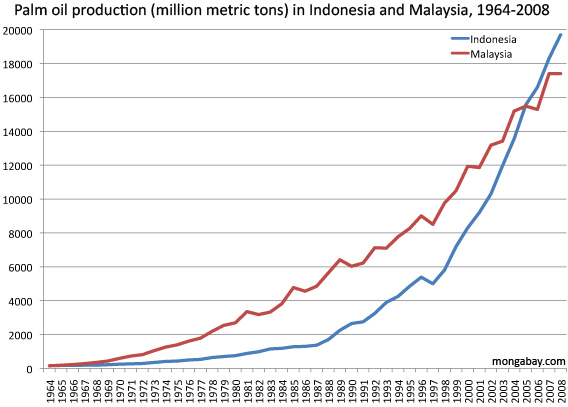
Figure 3: Deforestation by Country
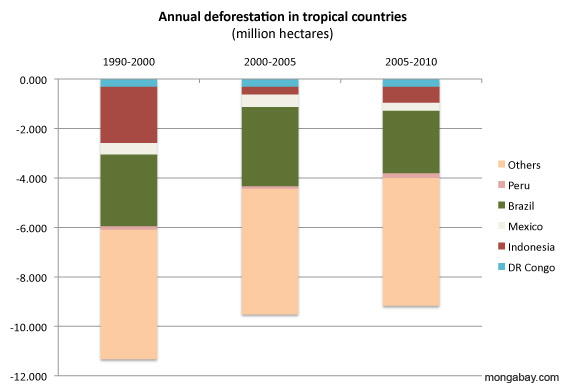 |
| Source: Mongabay.com |
Figure 4: Changes in Deforestation by Country
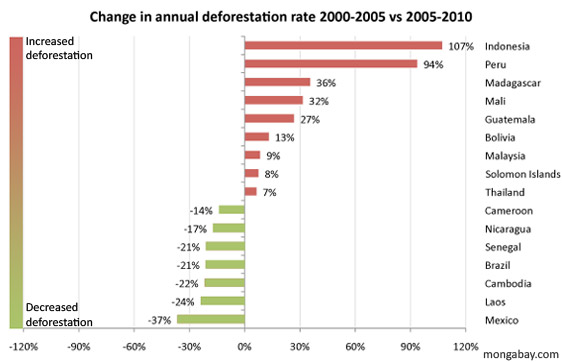 |
| Source: Mongabay.com |
Figure 5: Fire Emissions Resulting from Anthropogenic Involvement in Southeast Asia
 |
| Source: Mongabay.com |
Figure 6: Increasing Agricultural Land Usage in Southeast Asia
 |
| Source: Greenconduct.com |


0 comments:
Post a Comment